Projects
fetchr
A R package that provides a fast and scalable raster based method for calculating wind fetch distances for water grid cells within land water raster data.
Author and maintainer

cdssr + cdsspy
R (cdssr) and Python (cdsspy) packages for exploring and requesting resources from the CDSS REST API.
Author and maintainer

Predicting NFL game winners using Machine Learning
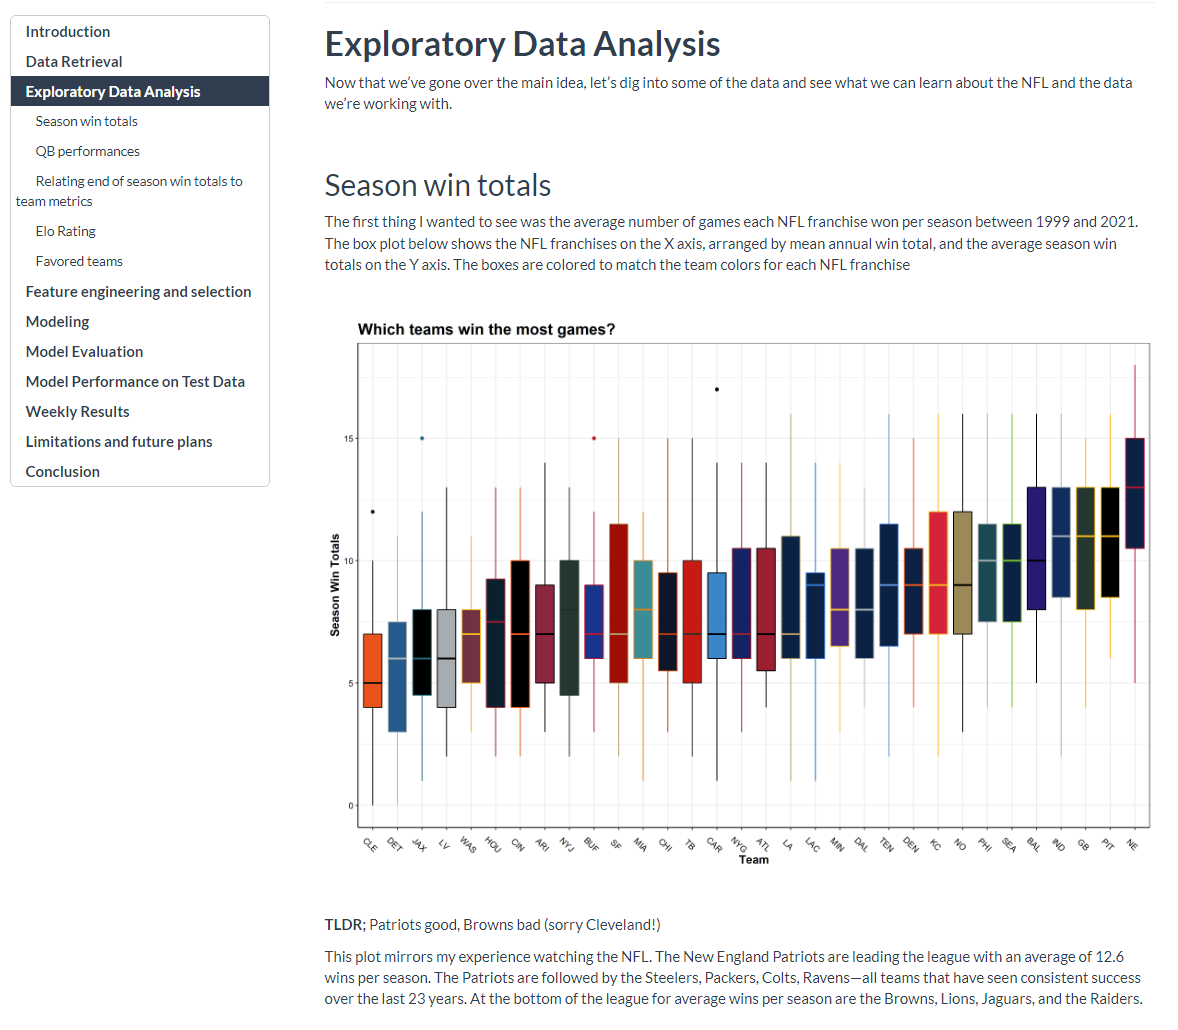
A machine learning side project where I attempt to predict the winners of NFL games.
Data ingestion, cleansing, and modeling done in R
REST API for generating predictions is in progress.
Model write up was done in an Rmarkdown document.
Data source: nflfastR
nflpredictR
R package for accessing and manipulating data from the NFL Win Prediction model API I created for the project above.
Data sources: Pro Football Reference, CBS Sports

CPO
Built using R-Shiny
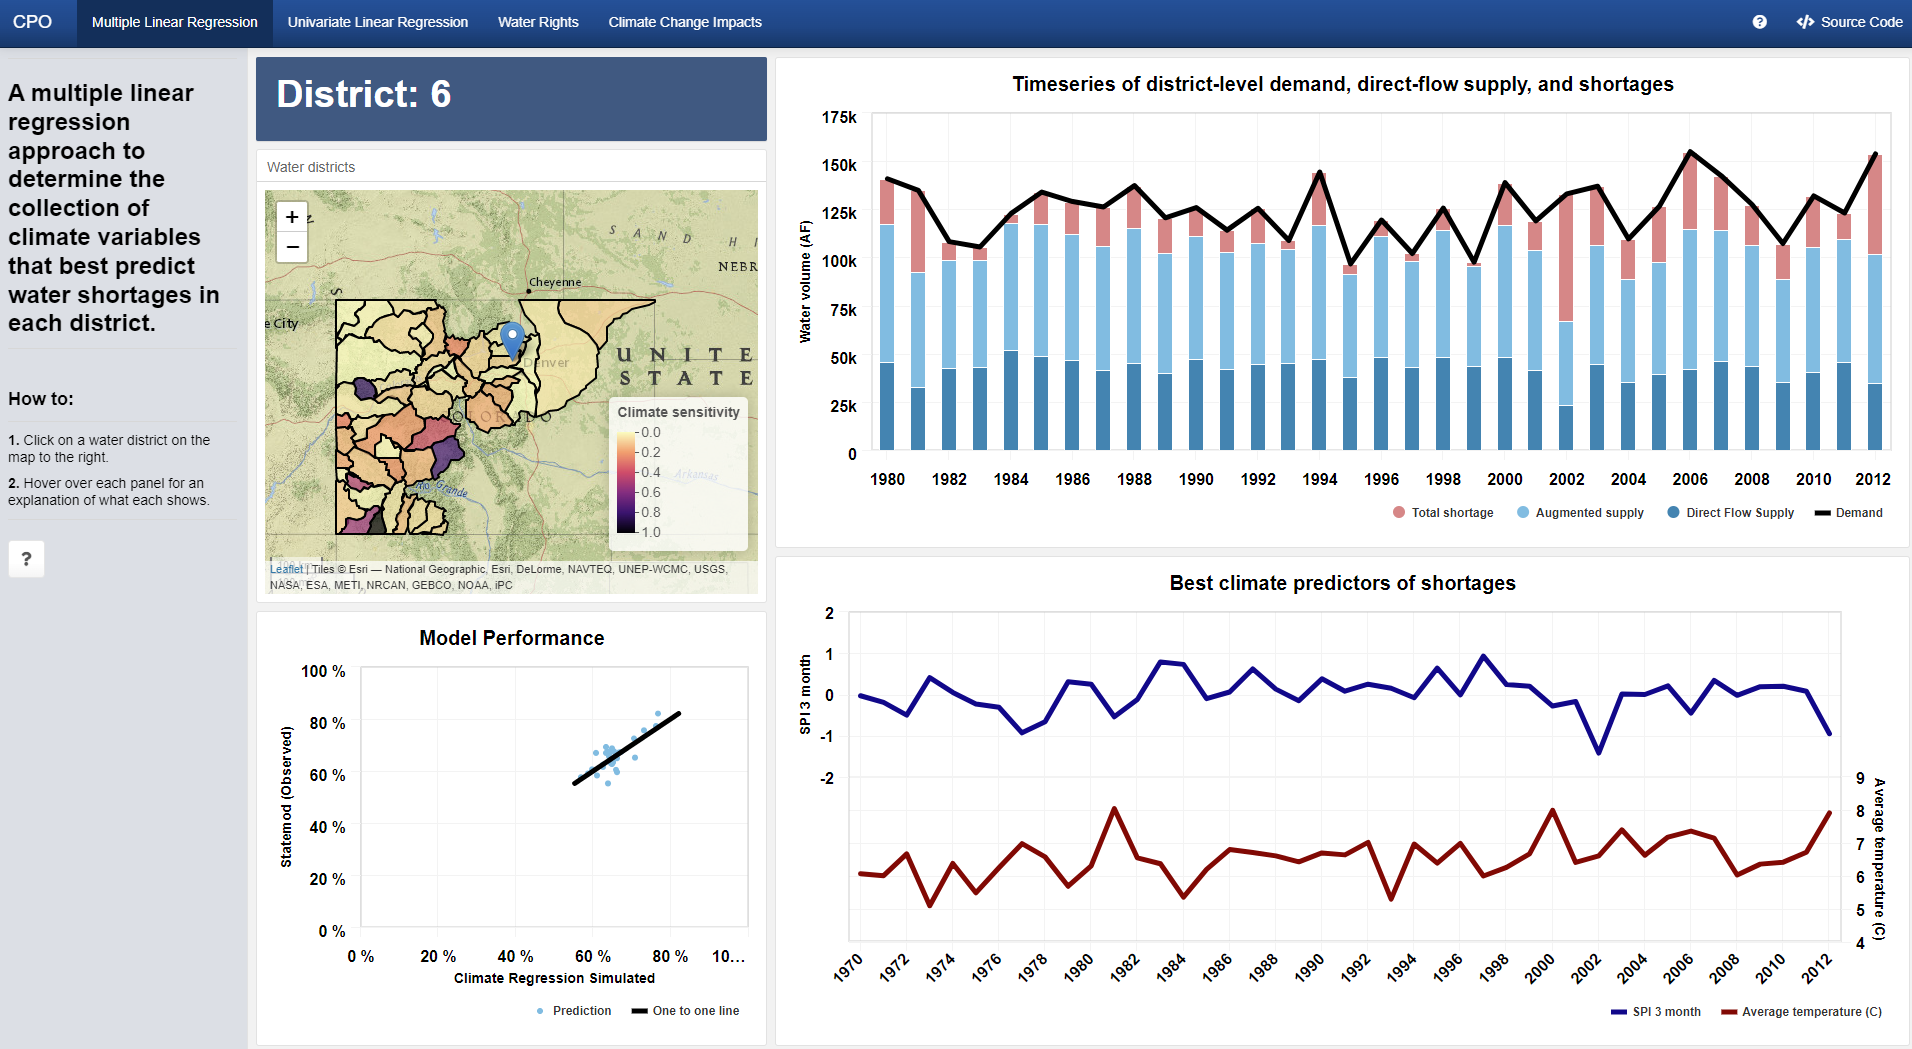
On-call shiny app for exploring CDSS’s StateMod data. StateMod is a monthly and daily surface water allocation and accounting model maintained by Colorado’s Decision Support Systems
There are 4 tabs for different modeling efforts put forth to understand the interaction between climate variables and water shortages across water districts and for specific water right.
Data source: CDSS
Colorado Low head dam analysis
Built using R-Shiny
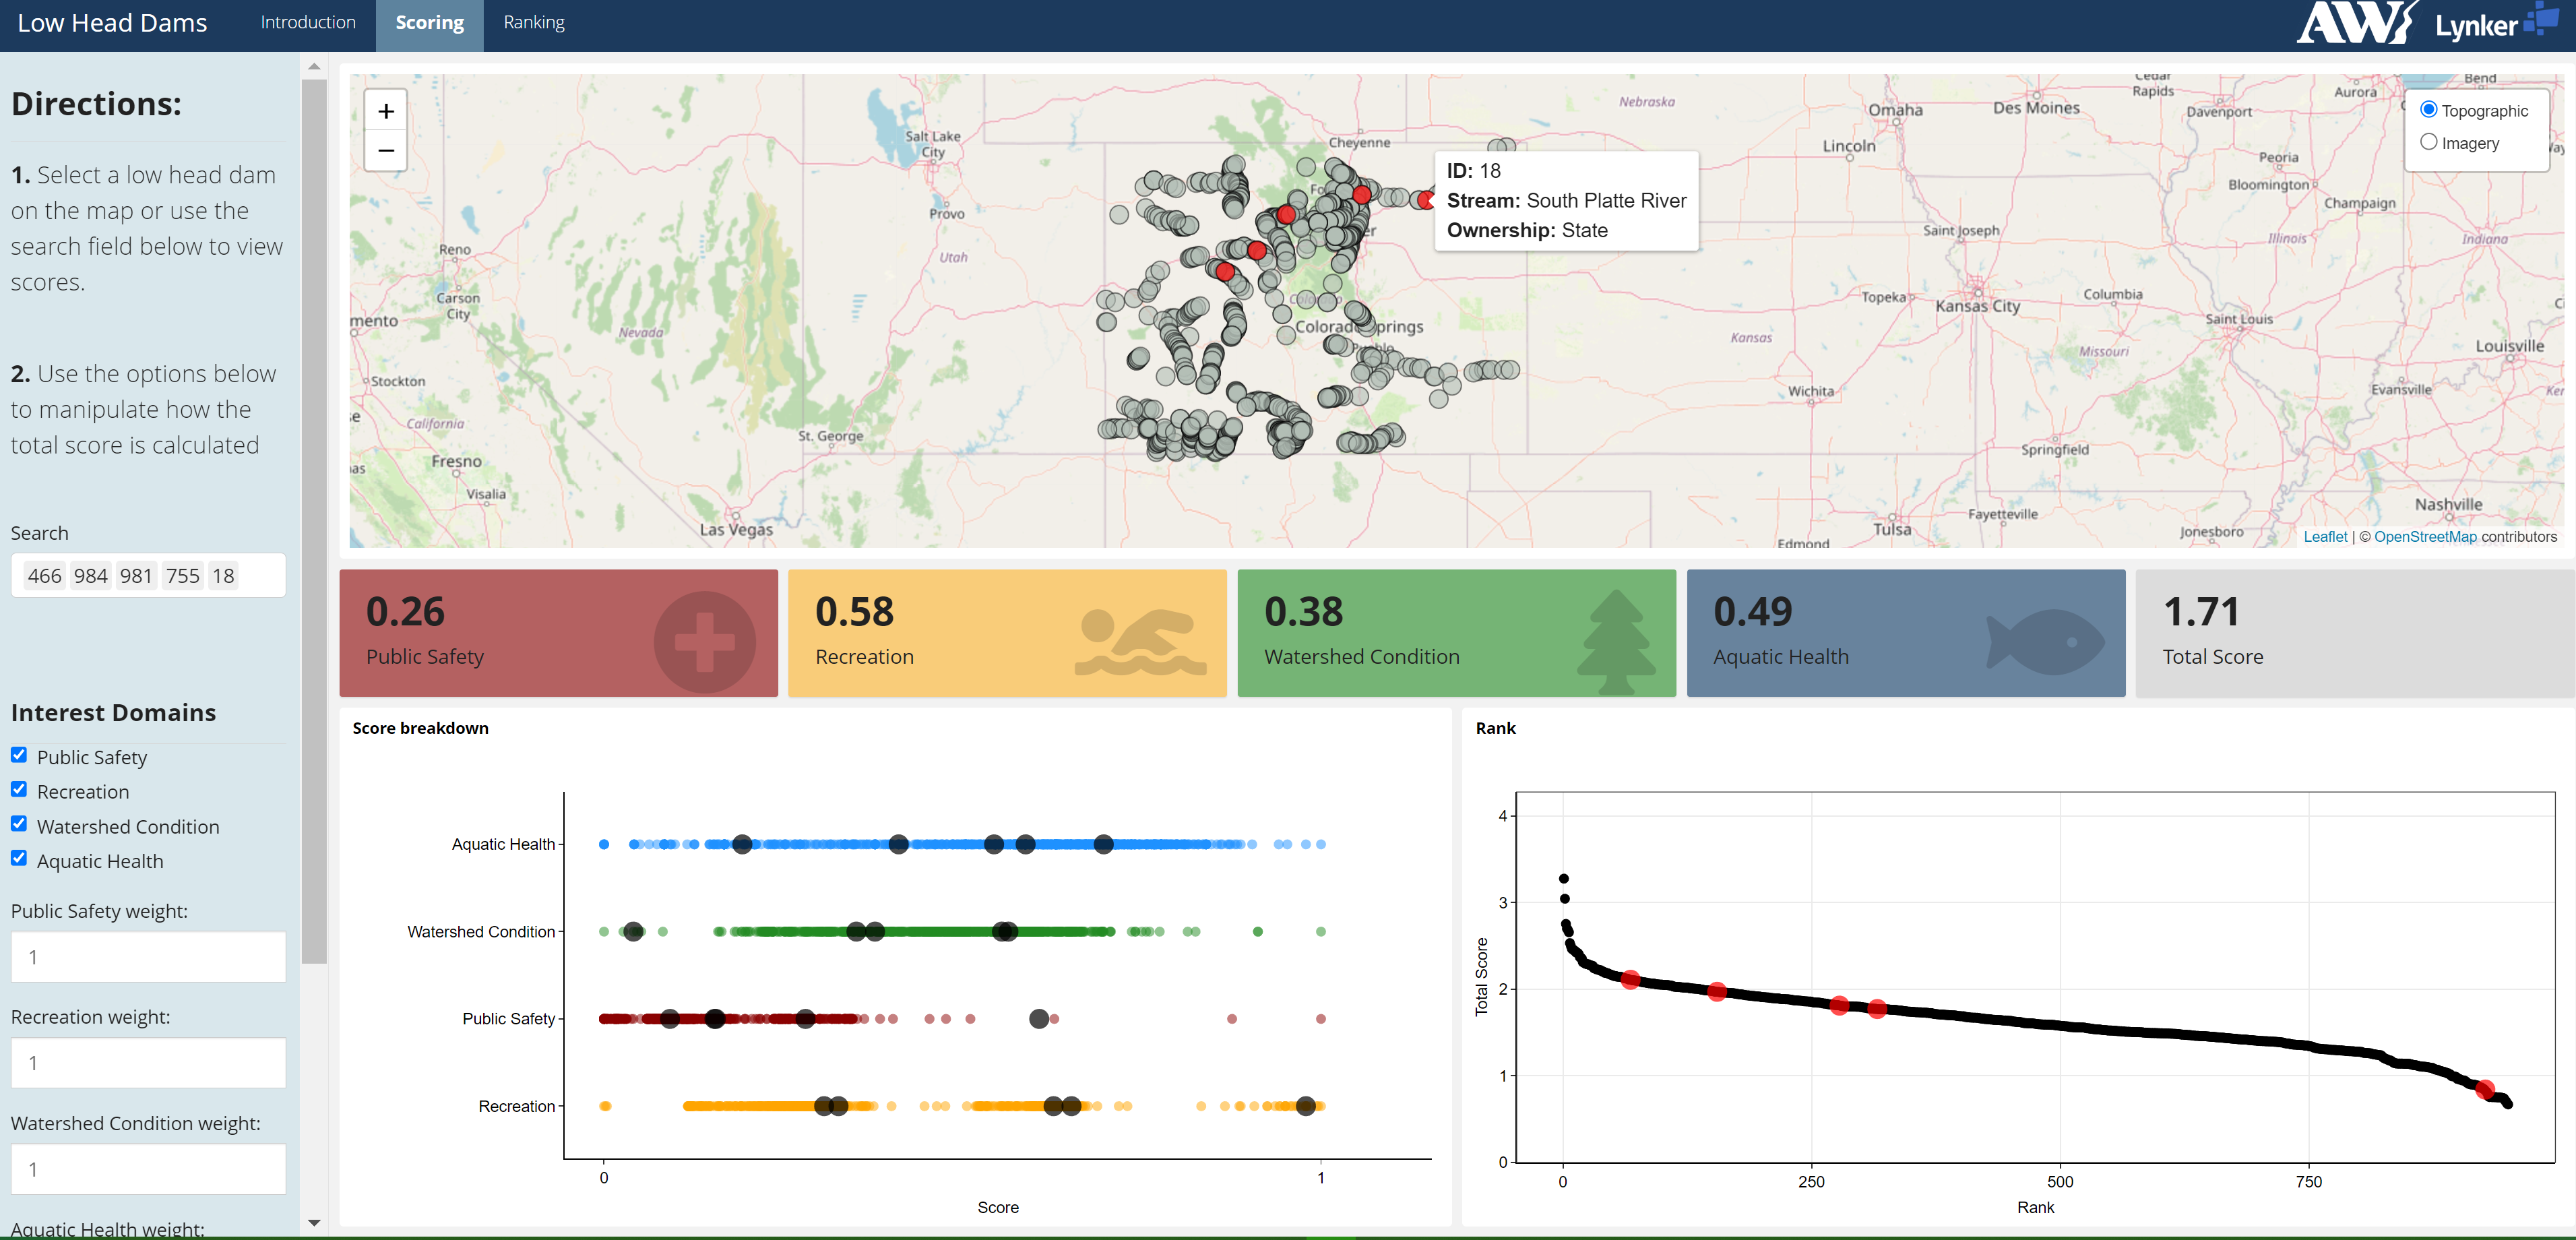
On-call shiny app for exploring Low head damn locations in Colorado and the results of a risk analysis assessment done on each location.
NWIS Water use
Built using R-Shiny
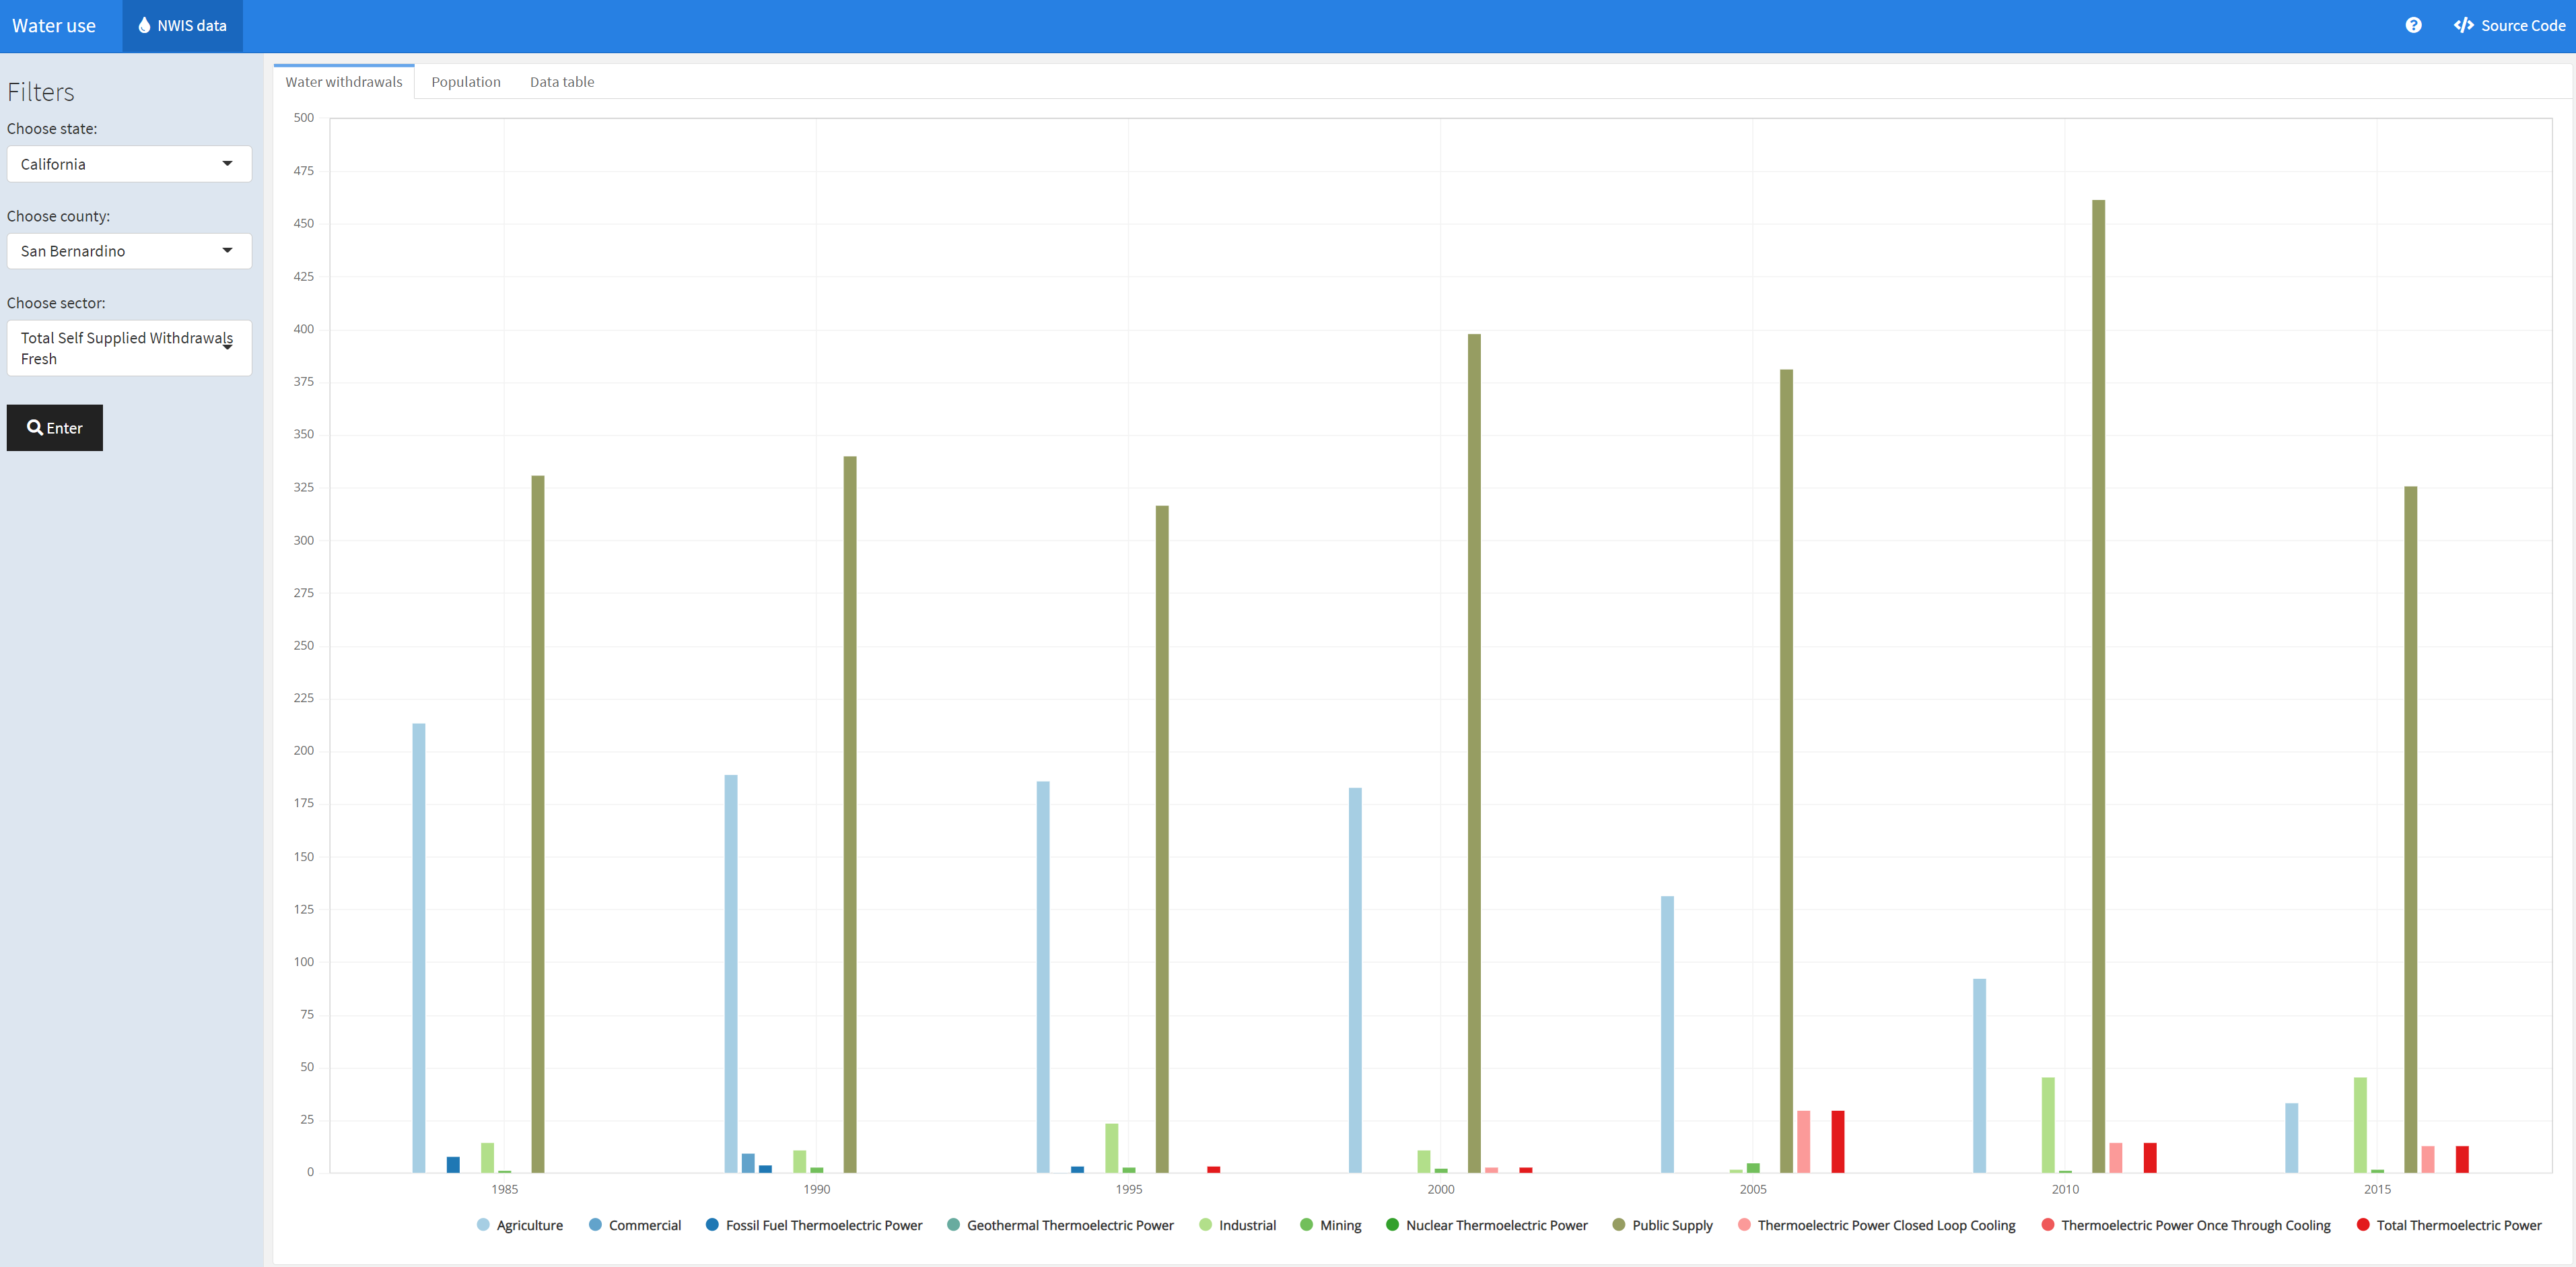
On-call shiny app for US water sector withdrawals by county
Accesses and visualizes NWIS Water use data in a Shiny GUI.
Data source: USGS
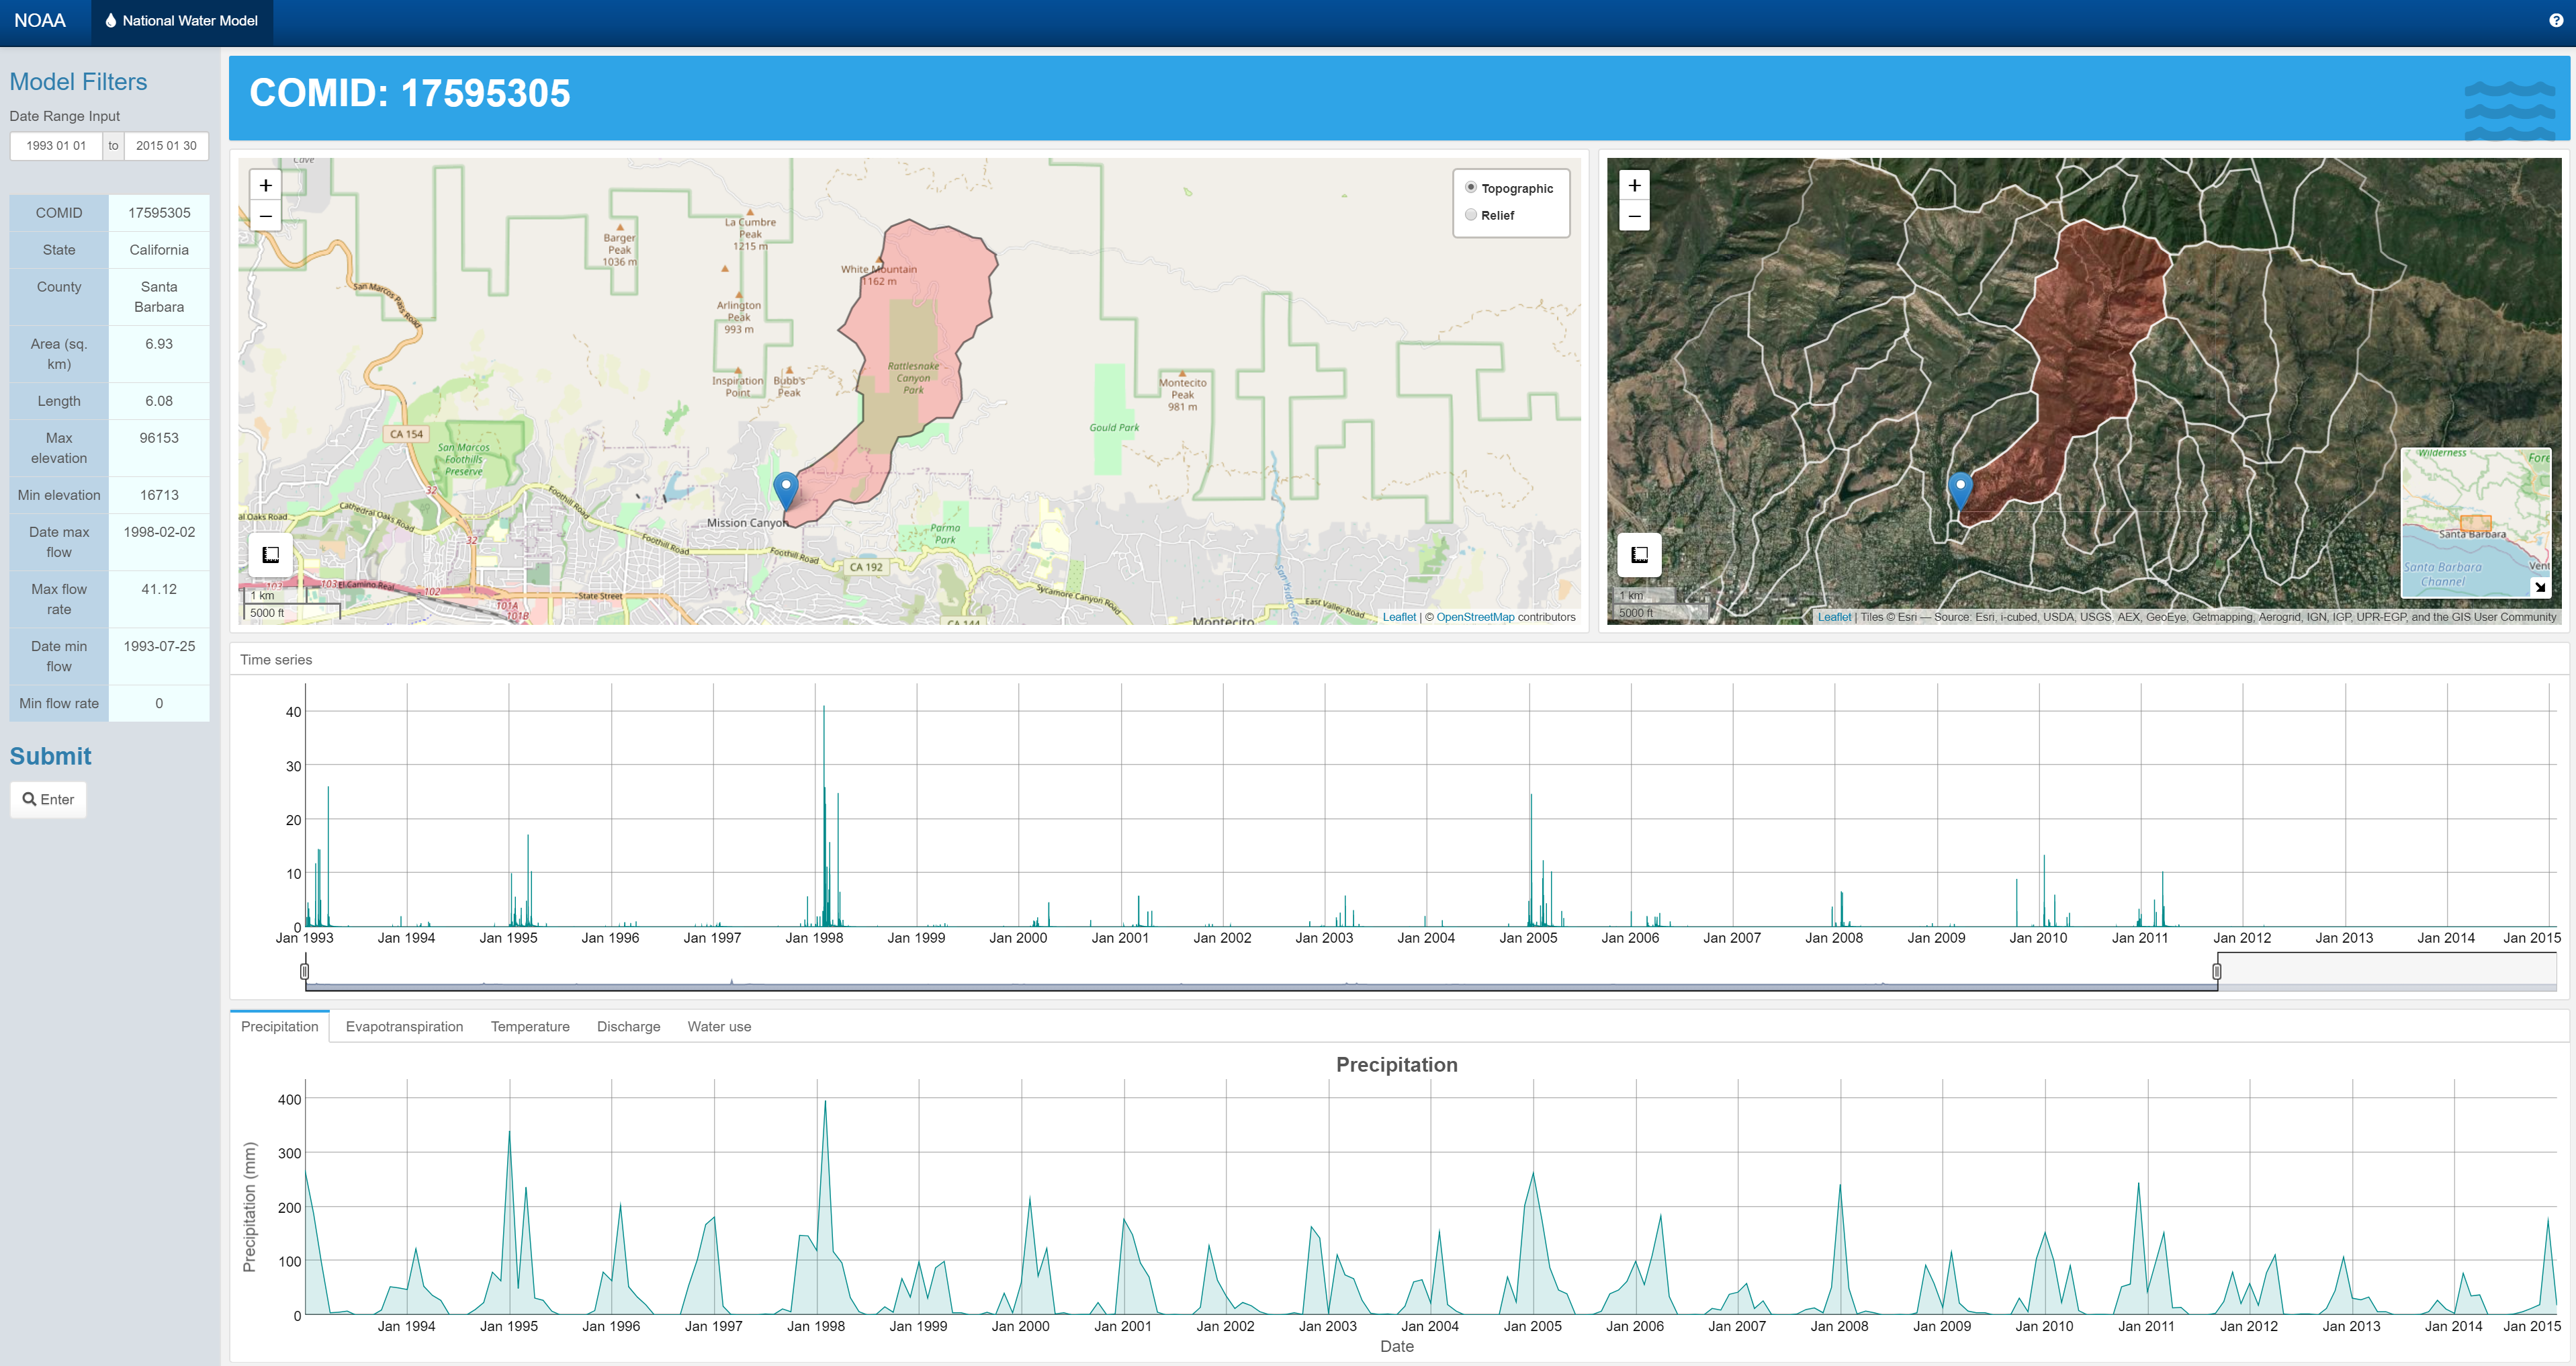
National Water Model ( UNDER CONSTRUCTION )
Built using R-Shiny
On-call shiny app for data exploration
Facilitates access to NOAA National Water Model reanalysis data through a convenient Shiny GUI.
Data source: NOAA
COVID-19
Built using R-Shiny dashboard
Tracking the COVID-19 pandemic in the United States
Independent project
Data source: New York Times
US dams
R Markdown
In this project I formed several tessellations over the US and then performed PIP analysis on dam locations within the US.
Methods used: Tesselations, Spatial Joins, Point-in-Polygon analysis, MAUP simplification
Data source: National Dam Inventory, US Army Corps of Engineers
Palo, Iowa Flood - Rasters analysis and Remote Sensing
R Markdown
In this project I worked with rasters, RGB color variants, landsat images, and performed a K-means analysis to visualize regions were flooding has occurred.
Methods: Landsat raster extraction, Clustering, K-means analysis
Santa Barbara, CA Mission Creek Flood - Terrain Analysis
R Markdown
In this project I used Open Street Map data to locate buildings and streams within a bounty box and then used Whitebox tools to analyze the terrain in the region.
Data source: USGS National Water Information System
COVID-19 Pandemic - Data Wrangling
R Markdown
I calculated the adjusted case rate, the number of new COVID-19 cases per 100,000 residents over a 7 day period, which the California government uses as a risk level criteria. I then created a county level choropleth map of California detailing county risk levels.
Data source: New York Times